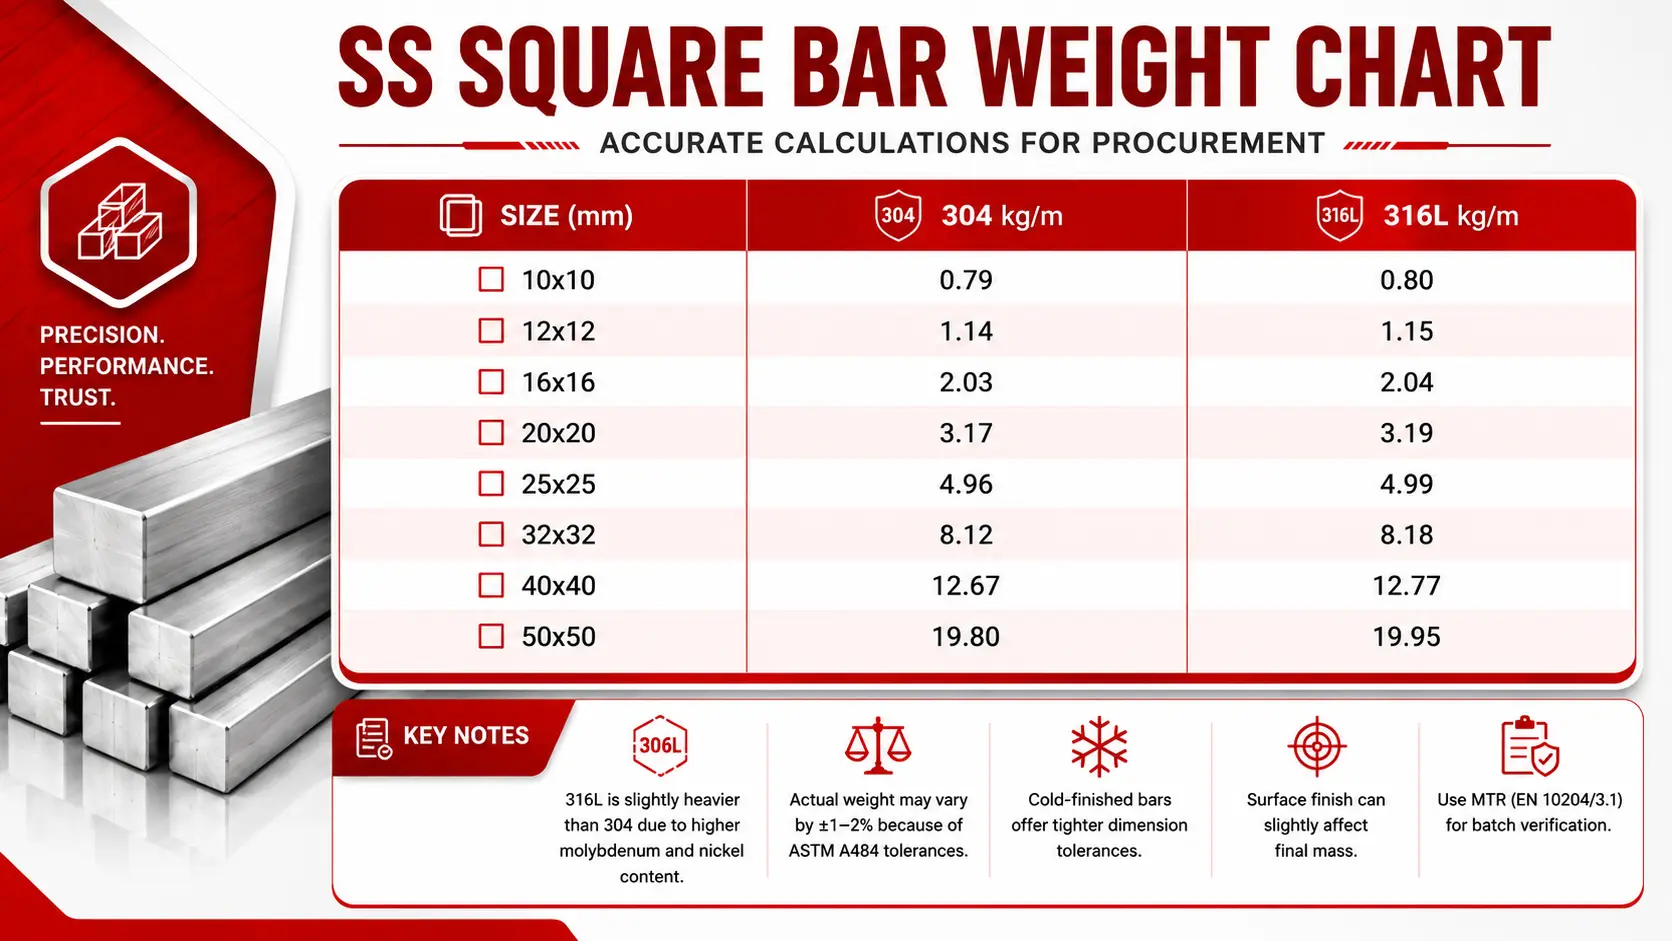
SS Square Bar Weight Chart
Standard weight chart for 304/316L stainless steel
For quick estimation, the following table provides the theoretical weight per meter for the most common austenitic grades—Grade 304 and Grade 316L. These values are calculated at the nominal cross-section using industry-standard density constants.
| Size (mm) | 304 Weight (kg/m) | 316L Weight (kg/m) |
|---|---|---|
| 10 × 10 | 0.79 | 0.80 |
| 12 × 12 | 1.14 | 1.15 |
| 16 × 16 | 2.03 | 2.04 |
| 20 × 20 | 3.17 | 3.19 |
| 25 × 25 | 4.96 | 4.99 |
| 32 × 32 | 8.12 | 8.18 |
| 40 × 40 | 12.67 | 12.77 |
| 50 × 50 | 19.80 | 19.95 |
Note: These figures serve as the baseline for your Bill of Materials. For technical verification of these sizes, refer back to our Stainless Steel Square Bar Specifications page.
Determining weight variance for high-nickel alloys
Precision in weight calculation is non-negotiable when transitioning from design to procurement. Because 316L includes higher Molybdenum and Nickel content, its density is higher than the standard Grade 304 alloy. When your procurement team prepares a quote, using the correct grade-specific weight ensures that freight logistics and material handling budgets are accurate.
Imperial reference for international project standards
For projects where specifications are governed by imperial dimensions, use the following conversion reference. This data helps align international engineering drawings with local supply capabilities.
| Size (inches) | 316L Weight (kg/m) | Weight (lbs/ft) |
|---|---|---|
| 1/2″ × 1/2″ | 0.50 | 0.34 |
| 3/4″ × 3/4″ | 1.13 | 0.76 |
| 1″ × 1″ | 2.01 | 1.35 |
| 1-1/4″ × 1-1/4″ | 3.14 | 2.11 |
| 1-1/2″ × 1-1/2″ | 4.52 | 3.04 |
Dimensional Tolerances and Their Impact on Weight
How ASTM A484 tolerances affect actual vs. theoretical weight
Theoretical weight charts are calculated using nominal dimensions. However, manufacturing standards like ASTM A484 permit specific dimensional deviations. A bar produced at the upper limit of its tolerance band will physically weigh more than the value listed in our chart. For procurement managers and quality assurance teams, understanding that a ±1–2% variance is within technical specification is essential for verifying incoming material without rejecting compliant batches.
Understanding size variations in cold-finished bars
Cold-finished square bars are typically produced to tighter tolerances (e.g., h10 or h11) compared to hot-rolled alternatives. This process ensures dimensional precision for secondary machining but results in an actual cross-section that is marginally smaller than the nominal size. If your assembly requires an exact "fit" for high-tolerance guide rails or mounting components, our Grade Comparison & Machining Guide provides the specific tolerance ranges we maintain for our inventory, ensuring your calculations account for these precise physical dimensions.
Factoring in surface finish in your estimates
The surface condition of your square bar—whether black, bright, or polished—directly influences the effective mass. While the density of the base metal remains consistent, high-precision surface finishing processes remove a thin layer of material. For engineers calculating load-bearing capacity for architectural or structural frameworks, it is important to confirm that the weight used in your structural model aligns with the finish specified for your order. If you need clarity on how our finishes impact the weight-to-performance ratio for your specific application, you can reach out to our technical team for a consultation via our RFQ & Inquiry Page.
Practical Applications for Weight-Based Estimation
Estimating total freight costs
Logistics efficiency is driven by net weight data. By utilizing the specific mass of your Grade 304 or Grade 316L square bars rather than generic carbon steel estimates, your logistics team can accurately calculate transport requirements. This avoids "re-weigh" fees and ensures that your budget for shipping aligns with the tonnage listed on your Stainless Steel Square Bar Specifications.
Calculating load-bearing requirements
Structural integrity depends on using the correct weight variables in your design models. Whether you are building structural frameworks or high-precision machine bases, our data ensures your calculations for dead load are accurate. For detailed insights into how these grades perform under industrial stress, you can review our Industrial Standards & Compliance Guide.
Batch weight verification using MTR
Every delivery is accompanied by an EN 10204/3.1 Mill Test Report (MTR). We recommend that your quality team cross-reference the actual bundle weight from the MTR against the theoretical weights found on this chart. This simple audit step provides the documentation required for ISO compliance and project-site quality control.
Frequently Asked Questions on SS Square Bar Dimensions
How do I calculate the weight for a non-standard size?
Use the formula provided in the first section of this guide. If you have a unique dimension not found in our stock lists, contact our team to evaluate your specific manufacturing requirements.
Is there a weight difference between 304 and 316?
Yes. Due to the addition of Molybdenum and higher nickel content, Grade 316L is slightly denser than Grade 304. While the difference per meter is small, it is significant for bulk orders. Always use the grade-specific density when finalizing your procurement order.
Where can I view full availability of these square bar sizes?
This weight chart covers our standard inventory. For current availability, cut-to-length services, and lead times, please refer to the main stainless steel square bar product section on our website.